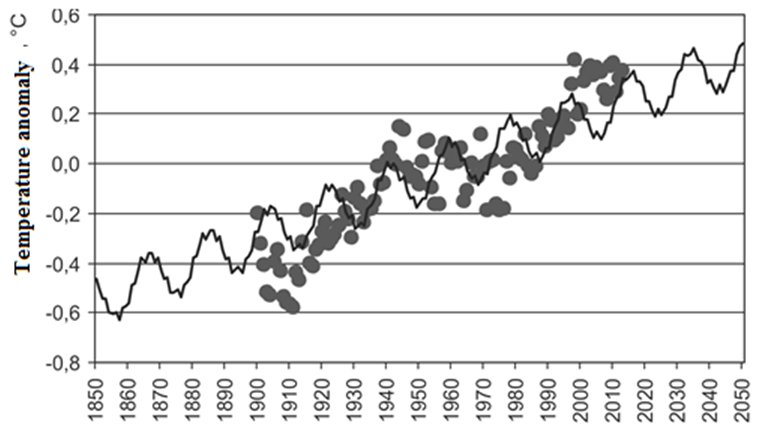
Fig.5 Distribution of World Ocean surface temperature anomaly values calculated from 1850 to 2050 (sine wave) and actual values from 1900 to 2013 (relative to the mean value for 1961 – 1990).