| |
SOLAR RADIATION AND CLIMATE
OF THE EARTH |
|
V.
M. Fedorov, P. B. Grebennikov We calculated the incoming solar radiation to the surface of the Earth ellipsoid (in the absence of an atmosphere).The comparative analysis of the incoming solar radiation and surface temperature anomalies to determine the effect of enhancing of the inter-latitude heat transfer. The analysis of the Northern Hemisphere sea ice extent and incoming solar radiation revealed a close relationship between them. Based on the regression equation we calculated the Northern Hemisphere sea ice extent from 2014 to 2050. Keywords: sea ice, solar radiation, inter-latitude heat transfer, solar climate
The changes in the Earth's cryosphere associated primarily with global temperature variations, which is one of the main indicators of the changing climate. Climate is the most important characteristic of the natural environment. Therefore, research on the global climate change and the reasons causing it are one of the most important problems in natural science (Monin, Shishkov, 1979; Monin, 1982; Monin, Shishkov, 2000; Kondratyev, 1987). In XX century, there was a trend of increase in global surface temperature, but the reasons for this are not clear. One of the main causes of global climate change is considered a "greenhouse" effect. It is associated mainly with the anthropogenic impact on the climate (Ershov, 1997; Anthropogenic climate change, 1987; http://www.wmo.int/pages/index_ru.html). It is unquestionable that solar radiation supplying the Earth by light and heat is the most important factor in the Earth’s climate genesis (Shuleykin, 1953; Lorenz, 1970; Budyko, 1974; 1980; Khrgian, 1986; Kondratyev, 1987; Monin, Shishkov, 1979, 2000). Solar radiation is "the main reason of nearly all meteorological events and processes occurring on the Earth's surface and in the atmosphere" (Voyeykov 1948, p. 166). Variations of the incoming to the Earth solar radiation are determined by two main reasons, which have different physical causes (Monin 1982). Studies of the variations of solar radiation associated with changes in activity of the Sun have a long history. For example, it is the study of sunspot formation and Schwabe - Wolf, Hale, Glasberg cycles. The links between changes in solar activity are discussed for long time (Abbot, 1957; Agensov, 1948, 1963; Kondratyev, Nicholsky, 1978; Vitinsky, 1983; Abdussamatov, 2009; Dudok de Wit, Watermann, 2010). In this work we present the results of studies of variations in solar climate associated with celestial mechanics processes. Changes in solar activity are not taken into account. Traditionally, solar flux variations which associated with the sky-mechanical processes (in the form of representations of astronomical theory of climate) are investigated for a very long time scales. This includes exposed secular perturbations of the orbital elements. It is the longitude of the perihelion, the eccentricity and the inclination of the Earth`s axis rotation. These perturbations are very significant for an extended period of variation (Milankovitch, 1939; Brouwer, Van Woerkom, 1950; Sharaf. Budnikova, 1968, 1969; Vernekar, 1972; Berger, 1978, 1988; Monin. 1982; Laskar, 1988; Berger, Loutre 1991; Monin and Shishkov, 2000; Melnikov, Smulsky 2004, 2009). The calculations of the incoming solar radiation and study of its spatial and temporal variability due to sky - mechanical processes, in the range of periodic perturbations of the elements of the earth's orbit and tilt of the rotation axis in detail was not conducted.
The secular trends of the global temperature change
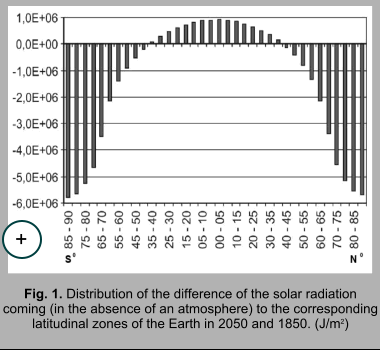
The reduction of the incoming to the Polar regions solar radiation is 5.79E+06 J/m2 from 1850 to 2050. This is 0.11% of the average for the 85°-90° latitude zones. An increase in the Equatorial region is considerably less. This increase is 9.15E+05 J/m2 (0.007%) at the equator area (0-5° latitude). The increase of the incoming solar radiation difference in these areas will be 6.70E+06 J/m2 in 2050, which is 0.09% higher than in 1850.
Calculated for the secular intervals correlation coefficient (R) (Fig. 2) are characterized by a high values for the average of the meteorological indicators data of the corresponding secular intervals (-0.961 - with the incoming radiation, 0.931 - with the difference). Meteorological data Indicator is the percentage of the Earth's surface covered by a 5-degree cells with meteorological data. According to the results of the correlation analysis the age-old intervals are allocated from 1900 - 1999 etc. up to 1914 - 2013 (Fig. 2). At these intervals the R values are sufficiently high (Table. 1) and very close to each other (the difference is less than 1.5%). These 100-years intervals are correspond to the most reliable HadCRUT3 data (http://www.cru.uea.ac.uk/cru/data/temperature) and accepted by us as a basis for constructing of the linear regression equations of the incoming solar radiation and temperature anomalies. Table 1. The average
correlation between anomalies of the surface temperature
Based on the regression equations amplitude temperature anomalies were calculated for the Earth and hemispheres from 1850 to 2050. The detailed comparison of the calculated and observed values was conducted for the period of reliable meteorological data for 1900 - 2013 (Fig. 3, 4). The R values between observed and calculated temperature anomalies are 0.826 for the Earth, 0.775 for the NH and -0.840 for SH.
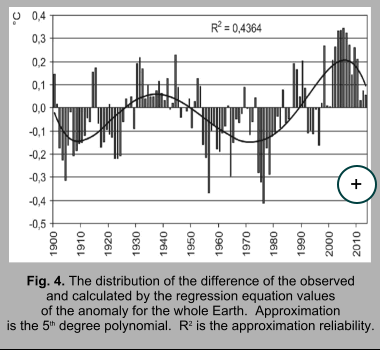
The distribution of differences between observed and calculated temperature anomalies for the Earth (the observed values minus the estimated) are shown in Fig. 4. The results are show that the average absolute value of the temperature anomalies in the Southern hemisphere (0.259°C) for the period from 1900 to 2013 exceeds the corresponding value obtained for the Northern hemisphere (0.237°C), i.e. temperatures in the Southern hemisphere increases more rapidly than in the Northern. In the Southern hemisphere we can see small differences between actual and estimated values of the air temperature (0.120°C - in the SH, 0.159°C – in the NH) and large R values between the temperature anomaly and solar radiation (table. 1). Thus, the temperature increase in the Southern hemisphere is associated with the inter-latitude heat transfer to a greater extent than in the Northern hemisphere. In Fig. 4 we can see a groups of observed temperature anomalies (lasting about 28 - 29 years) which are higher or below than the calculated. The full cycle of oscillation is approximately 56 to 58 years. On average for the Earth in each group 84.1% of the observed values are either above or below the calculated. Depending on this, they are defined as "warm" and "cold" respectively. For the Earth there are four such groups (era) from 1900 to 2013: 1900 - 1925 - "Cold", 1926 - 1953 - "Warm", 1954 - 1985 - "Cold", 1986 - 2013 - "Warm". These groups are synchronized with the allocated typing in atmospheric processes in the Northern hemisphere circulation epochs (Kononov, 2009). They are also similar to the intervals of different states of the current climate which reflecting the stages of interaction in the ocean - atmosphere system (Anisimov et al., 2012). Average modulo divergence between the actual and calculated values of the temperature anomalies is higher in the Northern hemisphere than in the Southern. Also, there is a better homogeneity criterion above or below the observed in groups (88.1% in the Northern and 75.3% in the Southern hemisphere). Therefore, we can assume that the discrepancy between the calculated and observed values of the temperature anomalies is determined by a disturbance of the inter-latitude heat transfer in the ocean – continent system. This effect is known as "heat machine of the second kind" (Shuleykin, 1953). This process is associated with the seasonal reversible change of the heat source and sinks areas. Also, it reduces the magnitude of the temperature anomalies (in the Northern hemisphere are larger than in the South), weakens the correlation between the temperature anomalies and solar radiation and increases the discrepancy between the calculated and actual values of the anomalies. Obtained for the secular intervals mean values of the differences was used as a correction in the calculations. With these amendments, the discrepancies between the calculated and actual average module data for the Earth reduced to 0.101°C, which is 11.6% less than the uncorrected. In the Northern hemisphere the corrected value is 0.114°C (18.9% less than without correction). In SH it is - 0,105°C (5.9% less than without correction). Also, the R-values between observed and estimated temperature anomalies data are increasing. For the Earth the value increases to 0.901 for the Northern hemisphere to 0.885 and for the Southern hemisphere to 0.890. It is known that the inter-latitude heat transfer is the most intense in the winter season of the hemispheres (Shuleikin, 1953). On the contrary, the analysis of the latitudinal distribution of the solar radiation shows that the enhancement of the inter-latitude heat transfer is more intense in the summer half of the year and less in winter half. Thus, we found at the present time the enhancing effect of the inter-latitudinal heat transfer ("heat machine of the first kind"). This effect associated with the reduction of the incoming solar radiation to the Polar regions and increasing incoming solar radiation to the Equatorial region of the Earth. The enhancing effect of the inter-latitudinal heat transfer is observed both in the atmosphere and in the ocean surface layer (data archive HadSST3). Enhancing effect of the inter-latitudinal heat transfer is determined by the secular changes of the tilting of the Earth's rotation axis. With this effect associated the increasing of the inter-latitudinal secular trend of the surface temperature anomalies on the Earth in the modern era (Fedorov, 2014). One of the results of the enhancing effect of the inter-latitude heat transfer is the secular trends in the cryosphere, such as the reduction in the sea ice cover, degradation of the land glaciation and permafrost.
The secular trends of the sea ice extent in the Northern hemisphere Arctic sea ice extent varies seasonally from about 6 x 10⁶ km2 in the summer to about 15 x 106 km2 in the winter (Comiso, Nishio 2008; Cavalieri, Parkinson 2012; Meier et al 2012). That is, sea ice extent is reduced by more than half in summer. Also, the incoming solar radiation reduced more then twice in the winter half of the year (Tab. 2). The calculated data of the incoming to the upper-limit of the atmosphere solar radiation (in the absence of an atmosphere) were compared with sea ice extent data in the Northern hemisphere of the Earth from 1870 to 2008 (Wаlsh, Chapman, 2001; Rayner et al., 2003; http://arctic.atmos.uiuc.edu/SEAICE/timeseries.1870-2008; http://www.metoffice.gov.uk/hadobs; Wаlsh, Chapman 2012). The ice cover is the result of the interaction between the ocean and the atmosphere in certain temperature conditions (Burke, 1940; Zubov, 1938; Sea ice, 1997; Ice formations ..., 2006). The most important parameter of the ice cover is its area. Over time, this area is change. The most significant changes of the sea ice area are seasonal, inter-annual and long-term variations. The study of the sea ice extent changes and their causes are one of the most important tasks of the Cryolithology (Zubov, 1938; Zakharov, 1981; Zakharov, Malinin, 2000, sea ice, 1997). Table 2. Average values
of the solar radiation (MJ / m2) coming into the Northern
and Southern hemisphere
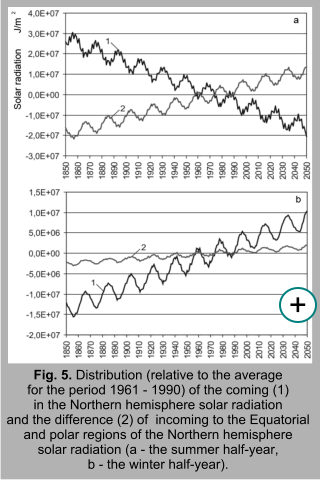
Three indicators of the sea ice extent dynamics in the Northern Hemisphere were analyzed. There are annual average, summer (minimum) and difference between maximum and minimum (seasonal amplitude) sea ice extent. The summer minimum of the sea ice extent is clearly localized in the annual cycle in September (autumnal equinox, the end of the summer half-year in the Northern hemisphere). The maximum of the sea ice extent is more extended in time from February to April (the period near the autumnal equinox, the end of winter and the beginning of the summer half-year in the Northern hemisphere) (Sea Ice, 1997). That is, the extreme values of the sea ice extent are characterized by a shift in the annual cycle relative to the values of the incoming solar radiation by about 90o. These indicators were compared with incoming solar radiation in the Northern Hemisphere for winter and summer half-year (in the absence of an atmosphere) (Fig. 5) and with the difference of the solar radiation coming into the source (0°N - 45°N) and sink (45°N - 90°N) area of the heat. The calculated correlation coefficients for the time series of the NH sea ice extent and incoming solar radiation from 1870 to 2007 are shown in table 3. Table 3. Average correlation
coefficient of the sea ice extent and solar radiation
Table 4. The mean correlation
coefficient of the sea ice and solar radiation on the secular intervals
(probability - 0.99).
Table 5. The correlation
coefficient of the sea ice extent and solar radiation
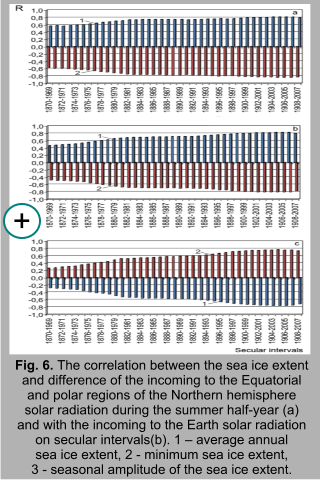
The correlation analysis of the relationship between sea ice extent and solar radiation (incoming on the upper-limit of the atmosphere and the difference coming in the equatorial and Polar regions) for the summer half-year was investigated in more detail. Firstly, it is determined by the fact that for the summer half-year for all seasonal sea ice extents were obtained higher values of the correlation coefficient (Table. 4, 5). Secondly, the fact that in the summer half-year marked a more significant increase in the inter-latitude heat transfer than in the winter half-year. The correlation was analyzed on a constant periods of 100 years (century interval) with a consistent offset from the beginning of the data array (1870) to the end (2007) (Table 2). Thus, the correlation coefficient were determined for the intervals 1870 - 1969, 1871-1970, etc. (all for 39 100-years intervals) (Fig. 6). The resulting distribution of the correlation coefficients on the 100-years intervals show the diversity of the reliability of the sea ice extent data (Rayner et al., 2003; Wаlsh, Chapman 2001). However, arrays are allocated century intervals (the last in the array) from 1900 - 1999 until 1908 – 2007 with higher correlation coefficient (Tab. 5). Also, these nine intervals have very close values of the correlation coefficient. For example, variations of the annual data are 1.10% (incoming radiation) and 0.98% (difference), for the minimum (summer) 0.71% and 0.66%, for the amplitude (winter minus summer) 0.65% and 0.75%. Possibly, these intervals correspond to the most reliable data of the sea ice extent data set (Rayner et al 2003). High and stable correlation coefficients reflect the actual and valid relationship of the sea ice extent and incoming solar radiation (Fig. 6; Tab. 5).That is why, the last nine 100-years intervals accepted by us as a basis for the regression equations. The second-degree polynomial was used for generation of the regression equations of the sea ice extent and solar radiation (incoming and difference). Total was generated nine regression equations for each of the three parameters of the sea ice extent on the best secular intervals. The second-degree polynomial was used because it has higher performance relative linear regression approximation (Tab. 6) and the fact that the sea ice is the result of interaction between the atmosphere and ocean. Table 6. R-squared values
of the second-degree polynomial regression equation of the sea ice extent
and incoming solar radiation.
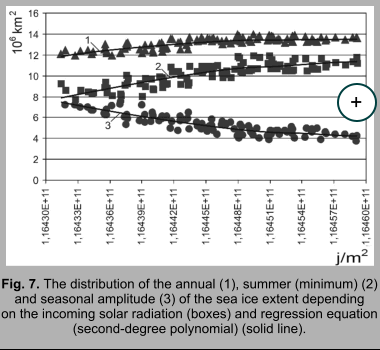
That is, the melting of the sea ice is the result of the thermal actions as air and water. The enhancing effect of the inter-latitude heat transfer observed both for the atmosphere and for the surface layer of the ocean. Thus, the enhancing reduction of the sea ice extent is shown two simultaneous factors associated with the ocean and the atmosphere. The quadratic form of the regression equation shows the acceleration in the impact on the sea ice dynamic (decrease) the enhancement effect of the inter-latitude heat transfer. The regression equations of the average reliable secular intervals are presented in Fig.7.
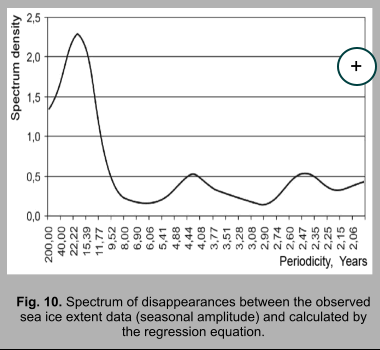
According to our estimates, the minimum Arctic sea ices extent in 2014 will be close to 7.20 mil km2. Consequently, its decline in 2050 was 29.3% compared to 2014. The difference between the ice area in winter and in summer will increase by 2050 relative 2014 at 1.90 million km2 (23.6%). In the interval between 2014 and 2050 accelerations defined by the effect of inter-latitude heat transfer is -0.00212 for annual, -0.00326 for summer and – 0.00293 million km2/ year2 for annual difference. Approximately 19-years nutation cycle appears on the background of secular trends (Fig.8). These cycles determine the change of the angle of inclination of the earth`s axis rotation and the associated latitudinal distribution of the incoming solar radiation (Fedorov, 2013. 2014). The average annual sea ice extent varies from the maximum for the last time in 2008 12.74 mil. km2 to a minimum in 2017 - 11.3 mil. km2. Then it rise until 2024 – 12.45 mil. km2 and reduction by 2036 – 10.72 mil. km2. The calculated values of the sea ice extent are highly correlated with Walsh and Chapman data (2001; 2012). Correlation coefficient of the series from 1870 to 2007 is 0.773 for the annual extent (0.823 until 2004), 0.841 for summer and – 0.827 for seasonal amplitude. The discrepancy between the observed (Walsh, Chapman 2012) and calculated data is 0.270 million km2 (or 2.067%) for the annual average area relative to the annual mean over the period from 1870 to 2007. For summer minimum difference is 0.467 million km2 (or 4.597%) and for winter minus summer – 0.400 million km2 (or 7.439%) (Fig. 9). On the Fig. 9 we can see a periodicity. This periodicity is associated with the presence of groups where the observed values are higher or lower than calculated. It stands out against the background of a general trend of increasing difference between the winter and summer sea ice extent. This indicates the existence of additional periodic factor not taken into account or not completely rated in the regression equation. The spectral analysis of variance shows that the dominant in the spectrum is an oscillation with 20-years period (Fig. 10). On the periodogram this maximum has a period equal to 18 years.
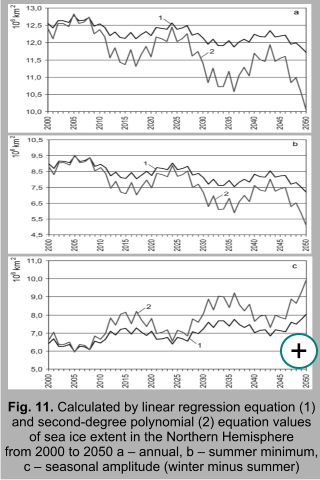
We calculated data for forecast scenarios. This forecast based on linear and quadratic forms of the relationship between the incoming on the surface of the earth`s ellipsoid solar radiation in the absence of atmosphere (North hemisphere) and the changes of the sea ice extent (Fig. 11). For calculations we are used two scenarios. There is a close link between these values, but the form of this connection is not unequivocally defined.
We are investigated the relationship between the variations of the sea ice extent and the accumulated incoming solar radiation. The beginning of the accumulation was taken 1871 - second year in the data set of the sea ice extent (http://www.metoffice.gov.uk/hadobs). The value of the accumulated radiation in 1971 was defined as the amount of annual income in 1870 and in 1871. The value in 1972 was obtained by summing the annual value of 1872 with the annual values of the incoming solar radiation over the previous two years. The calculations in the past occurred sequentially subtracting the annual values of the incoming radiation. From the value of 1870 subtract the value of incoming solar radiation in 1869. From this result was subtracted the value of 1868, etc. till 1850. The correlation between the accumulated in the summer half-year incoming solar radiation in the Northern hemisphere and the sea ice extent data (1870 - 2007) is -0.715 for the average annual extent, -0.776 for the minimum extent and 0.802 for the seasonal amplitude. These values are higher then data which calculated by the correlation analysis of the sea ice extent and the incoming solar radiation without accumulation (0.689, 0.762 and -0.791 respectively). Thus, the R-values increase by 3.6% for the average annual sea ice extent, 1.8% for the minimum (summer) sea ice extent and 1.4% for the seasonal amplitude. The R-values of the observed and calculated with considering the accumulation of solar radiation data (the polynomial of the second degree) for the period 1870 - 2007 are 0.882 for the average annual extent, 0.900 for the minimum and – 0.895 for seasonal amplitude. Also these values exceed the R values obtained without taking into account the accumulated solar radiation for 1870-2007 (0.778, 0.841 and 0.827 respectively). In this case the Increasing of the R values is 13.4% for annual average, 7.0% for the minimum and 8.2% for the seasonal amplitude of the sea ice extent. The differences between calculated and observed valuesof the sea ice extent without accumulation and including accumulation of the solar radiation are shown in Table 7.
Table 7. The difference
between the calculated (second-degree polynomial) values
The difference between the observed and calculated with accumulation of the solar radiation data of the sea ice extent is decreased. The reduction is 30.5% for the average annual sea ice extent, -31.3% for the minimum extent and - 19.8% for the seasonal amplitude. The results indicate that the dynamics of the sea ice extent is defined as the strengthening of the inter-latitudinal heat transfer and accumulation of heat associated with the incoming solar radiation (the greenhouse effect). The values of the sea ice extent calculated from the original series (Walsh, Chapman, 2001; Rayner et al., 2003; http://arctic.atmos.uiuc.edu/SEAICE/timeseries.1870-2008) are presented on the separate page of this section (The sea ice extent. Tab.1). Table 8. The sea-ice
extent (million km2) and accumulated solar radiation (j/m2)
coming for the summer half-year
The calculated values of the incoming to the earth's ellipsoid in the absence of the atmosphere solar radiation was also compared with shorter series of the satellite observations data of the sea ice cover dynamics from 1979 to 2013 in the Northern hemisphere (http://nsidc.org/data/docs/noaa/g02135_seaice_index/; Fetterer, 2002; Fetterer, Knowles, 2004). In contrast to previous longer, but complete series (Wаlsh, Chapman, 2001; http://arctic.atmos.uiuc.edu/SEAICE/timeseries.1870-2008; http://www.metoffice.gov.uk/hadobs) this data set is annually updated. Two indicators of the sea ice extent were analyzed in the Northern hemisphere. It is the maximum and minimum sea ice extent. The closest relationship between the multiyear dynamics of the sea ice extent and the accumulated coming on the top of the atmosphere solar radiation for the summer half-year and a tropical year in the Northern hemisphere was found (Tab. 8). The correlation between the maximum sea ice extent and the incoming solar radiation (the annual and summer) is -0.835. The correlation with minimum sea ice extent is -0.852.
The correlation between observed and calculated data of the minimum sea ice extent is 0.852. The average (absolute) value of the divergence is 0.430 million km2. It is 6.72% of the average annual minimum sea ice cover from 1979 to 2013 or 72.6% of the average modulo of the inter-annual variability. There are well known physical-mathematical (dynamic-thermodynamic models of the General atmosphere and ocean circulation and the physical-statistical models) models. These models calculate the sea ice extent in the Northern hemisphere up to 2090 (Brander et al., 2005; IPCC, 2013). Tab. 9 shows the calculated by the various physical-mathematical models data of the annual average maximum and minimum sea ice extent for 2011 – 2030. The average annual maximum and minimum sea ice extent calculated on the basis of the linear regression is 14.52 million km2 and 4.23 million km2 respectively for the same time intervals. Our maximum sea ice extent values are closest to the model data of the National Center for Atmospheric Research (USA). The minimum sea ice extent is close to the forecast of the Canadian Centre for Climate Modeling and Analysis. The values calculated based on the polynomial regressions are 14.31 million km2 and 2.66 million km2.
Table 9. The calculated sea ice extent in the Northern hemisphere.
Note: CGCM2 - Canadian Centre for Climate Modeling and Analysis, CSM_1.4 - National Center for Atmospheric Research, ECHAM4/0PYC3 - Max-Planck Institute for Meteorology, GFDL-R30_c - Geophysical Fluid Dynamics Laboratory, HadCM3 - Hadley Centre for Climate Prediction and Research.
The calculated by the models sea ice extent is significant differences between the values for the different models and between the calculated and observed data (Sea Ice, 1997). The most significant differences are observed for the calculated values of the minimum sea ice extent. On average the difference of the sea ice extent modeling results is 0.947 million km2 for the 2011-2030 or 16.6% of the average sea ice extent for all models (5.698 million km2) (Tab. 9). The differences between the calculated individual model results are determined by the differences in the calculation algorithms and used primary data. The differences between observed and calculated data reflect the level of adequacy of the physical-mathematical model. The summary analysis of the six IPCC models shows that the minimum (September) sea ice extent about 1 million km2 (i.e. "ice-free Arctic") will be reached in 2037 or in the interval from 2026 through 2046 (Wang, Overland, 2009; Liua et al., 2013). According to our data the minimum sea ice extent in 2050 will be about 1.6 million km2. It should be noted that all the model calculations based on assumed values of the temperature and (or) the carbon dioxide content. Depending on the set values are calculated corresponding values of the temperature, CO2 and sea ice extent. However, the input values are unknown in advance. We can assume that they are based on the statistical trend. That is, they are quite relative (Sea ice, 1997). Our estimates of the sea ice extent are based on relationship with the incoming to the top of the atmosphere solar radiation. The solar radiation is calculated on the prediction interval based on the astronomical ephemerides. These calculations appear to be more reasoned. However, these estimates have difficulty. These difficulties are related to definition of the relationship between the incoming radiation and sea ice, which is determined by a common problem predictable sea ice. The forms of this relationship are the main problem of the sea ice cover forecast. Calculated from satellite data (http://nsidc.org/data/docs/noaa/g02135_seaice_index/; Fetterer, 2002; Fetterer, Knowles, 2004) values of the sea ice extent are presented on a separate page of the section (Sea ice extent. Tab. 2).
Conclusion Here we show that at least at present time the inter-latitude atmospheric heat transfer is enhanced by decreasing incoming solar radiation to Polar regions and increasing incoming solar radiation to the equatorial regions. Thus, presently unknown effect of the increase in the inter-latitude heat transfer is found. The increase of the inter-latitude heat transfer is more intense in the summer half-year and less intense in the winter half-year. The effect of the increase in the inter-latitude heat transfer associated with the change in the slope of the earth`s axis rotation as a result of precession and nutation. The increase of the secular trend of the surface temperature anomalies in the Polar regions and the reduction of the Arctic sea ice extent is associated with the effect of the inter-latitude heat transfer at the present time. The correlation between the accumulated in the summer half-year incoming solar radiation in the Northern hemisphere and the sea ice extent data (1870 - 2007) is -0.715 for the average annual extent, -0.776 for the minimum extent and 0.802 for the seasonal amplitude. These values are higher then data which calculated by the correlation analysis of the sea ice extent and the incoming solar radiation without accumulation (0.689, 0.762 and -0.791 respectively). Thus, the R-values increase by 3.6% for the average annual sea ice extent, 1.8% for the minimum (summer) sea ice extent and 1.4% for the seasonal amplitude. In this case the Increase of the correlation is 13.4% for annual average, 7.0% for the minimum and 8.2% for the seasonal amplitude of the sea ice extent. The difference between the observed and calculated with accumulation of the solar radiation data of the sea ice extent is decreased. The reduction is 30.5% for the average annual sea ice extent, -31.3% for the minimum extent and - 19.8% for the seasonal amplitude. The increase of the correlation and the reduction of the discrepancies indicate the accumulation of the heat associated with the incoming to the atmosphere and to the surface layer of the oceans solar radiation. The higher estimates of the relationship between the sea ice extent and the accumulated solar radiation proving the impact of the enhanced greenhouse effect to the secular trend of the sea ice extent. The linear regression calculations based on the J. Walsh and W. Chapman long data set shows that the average annual sea ice extent in 2050 will be 12.02 million km2, the minimum extent - 7.95 million km2 and the seasonal amplitude – 7.24 million km2. The reduction of the average annual sea ice extent is about 3.0%, and the minimum was 8.8% relatively 2014. The seasonal amplitude is increased by 10.4%. The polynomial relationship show that the average annual extent in 2050 will be 9.78 million km2, the minimum - 4.16 million km2, and the seasonal amplitude is increased to 10.05 million km2. Thus, the reduction of the average annual extent is 15.3%, and the minimum - 42.9% relatively 2014. The seasonal amplitude is increased by 31.7%. The linear regression estimates for shorter series of the satellite observations show that the maximum sea ice extent in 2050 will be 13.33 million km2 and minimum will be 1.60 million km2. In this case, the reduction relative 2014 will be 9.8% and 66.7% respectively. The results indicate a new direction in the study of the cryospheric processes. The most important question is the definition of the relationship forms between the cryospheric indicators and incoming solar radiation. These studies may have practical importance for the natural resources exploration, oil and gas mining on the Arctic shelf, development of fisheries, navigation and construction of the hydrotechnical and other facilities on the permafrost. New fundamental research of the cryospheric processes required for the development of the strategic plans for a new stage of development of the Russian Arctic.
|
|||||||||||||||||||||||||||||||||||||||||||||||||||||||||||||||||||||||||||||||||||||||||||||||||||||||||||||||||||||||||||||||||||||||||||||||||||||||||||||||||||||||||||||||||||||||||||||||||||||||||||||||||||||||||||||||||||||||||||||||||||||||||||||||||||||||||||||||||||||||||||||||||||||||||||||||||||||||||||||||||||||||||||||||||||||||||||||||||||||||||||||||||||||||||||||||||||||||||||||||||||||||||||||||||||||||||||||||||||||||||||||||||||||||||||||||||||||||||||||
 Calculated (in accordance with the method of calculation) values of
the incoming on the Earth's ellipsoid (in the absence of the atmosphere)
solar radiation were compared with temperature anomalies data for the
period from 1850 to 2013 (
Calculated (in accordance with the method of calculation) values of
the incoming on the Earth's ellipsoid (in the absence of the atmosphere)
solar radiation were compared with temperature anomalies data for the
period from 1850 to 2013 (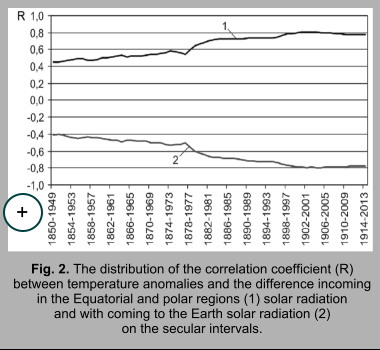 The study of the relationship between air temperature data and solar
radiation was based on the correlation and regression analysis. The
correlation was investigated in rows with a period of 100 years (the
secular interval) with sequential shift them (in increments of 1 year)
from the beginning (1850) to the end (2013) of the temperature anomalies
data set. The calculated values of the incoming to the Earth and hemispheres
solar radiation for the tropical year (Fedorov,
2013; Fedorov, 2013) (in the absence of an atmosphere) compared
with the temperature anomaly data presented in four archives database
University of East England and the Hadley Centre (
The study of the relationship between air temperature data and solar
radiation was based on the correlation and regression analysis. The
correlation was investigated in rows with a period of 100 years (the
secular interval) with sequential shift them (in increments of 1 year)
from the beginning (1850) to the end (2013) of the temperature anomalies
data set. The calculated values of the incoming to the Earth and hemispheres
solar radiation for the tropical year (Fedorov,
2013; Fedorov, 2013) (in the absence of an atmosphere) compared
with the temperature anomaly data presented in four archives database
University of East England and the Hadley Centre (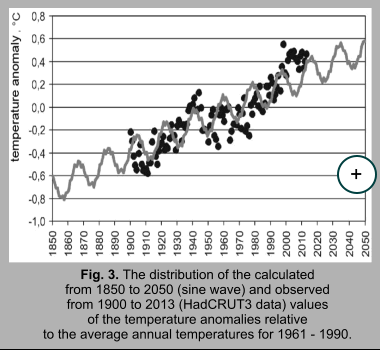
 We calculated parameters of the sea ice cover from 1850 to 2050. These
calculations were made on the basis of regression equations of the incoming
solar radiation and indicators of the sea ice extent. Incoming solar
radiation was used due to the higher correlation and reliability in
comparison with the heat source and sink areas difference. Probably,
the incoming solar radiation has a better relationship with the sea
ice extent parameters.
We calculated parameters of the sea ice cover from 1850 to 2050. These
calculations were made on the basis of regression equations of the incoming
solar radiation and indicators of the sea ice extent. Incoming solar
radiation was used due to the higher correlation and reliability in
comparison with the heat source and sink areas difference. Probably,
the incoming solar radiation has a better relationship with the sea
ice extent parameters. 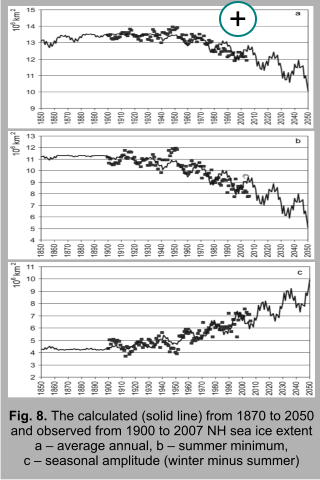 Calculations show that the enhancing effect of the inter-latitude heat
transfer accelerates the decreasing of the annual and summer minimum
sea ice extent. At the same time, the winter and summer sea ice area
difference increases mainly due to the accelerated decreasing of the
summer minimum ice extent. Thus, the annual average sea ice extent is
13.53 in 1900, 13.45 in 1950, 12.41 in 2000 and 10.05 million km2
in 2050. By our estimates, this value in 2014 should be close to 11.42
million km2. Consequently, by 2050, the annual Northern Hemisphere
sea ice extent will be reduced by 12% compared to 2014. The reduction
of annual sea ice is determined by the intensive decreasing in the summer
period. The effect of the increasing inter-latitude heat transfer is
more intensive in the summer half-year. So, the calculated data of the
minimum sea ice extent is 11.16 million km2 in 1900, 10.82
in 1950, 8.81 in 2000 and 5.09 million km2 in 2050.
Calculations show that the enhancing effect of the inter-latitude heat
transfer accelerates the decreasing of the annual and summer minimum
sea ice extent. At the same time, the winter and summer sea ice area
difference increases mainly due to the accelerated decreasing of the
summer minimum ice extent. Thus, the annual average sea ice extent is
13.53 in 1900, 13.45 in 1950, 12.41 in 2000 and 10.05 million km2
in 2050. By our estimates, this value in 2014 should be close to 11.42
million km2. Consequently, by 2050, the annual Northern Hemisphere
sea ice extent will be reduced by 12% compared to 2014. The reduction
of annual sea ice is determined by the intensive decreasing in the summer
period. The effect of the increasing inter-latitude heat transfer is
more intensive in the summer half-year. So, the calculated data of the
minimum sea ice extent is 11.16 million km2 in 1900, 10.82
in 1950, 8.81 in 2000 and 5.09 million km2 in 2050.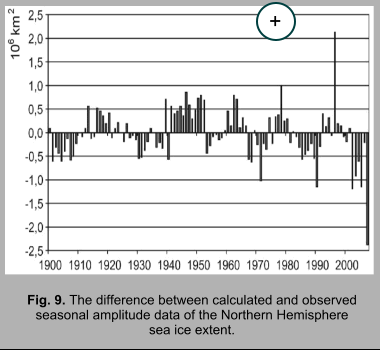
 It is likely that the observed periodicity is determined by the nutation
cycle. For example, a similar periodicity was observed in the oxygen
isotope composition of the ice in the South polar area (Vladimirov,
Ekaykin, 2014). The average duration of the positive and negative
groups is 9 to 10 years, i.e. corresponds to the duration of the phase
in the 19-year cycle. Given the averaged for positive and negative groups,
the magnitude of the differences for seasonal amplitude of the sea ice
extent is reduced from 7.439% to 5.136% for the average annual. The
correlation increases from 0.827 to 0.908. For other indicators of the
sea ice extent this periodicity is less.
It is likely that the observed periodicity is determined by the nutation
cycle. For example, a similar periodicity was observed in the oxygen
isotope composition of the ice in the South polar area (Vladimirov,
Ekaykin, 2014). The average duration of the positive and negative
groups is 9 to 10 years, i.e. corresponds to the duration of the phase
in the 19-year cycle. Given the averaged for positive and negative groups,
the magnitude of the differences for seasonal amplitude of the sea ice
extent is reduced from 7.439% to 5.136% for the average annual. The
correlation increases from 0.827 to 0.908. For other indicators of the
sea ice extent this periodicity is less.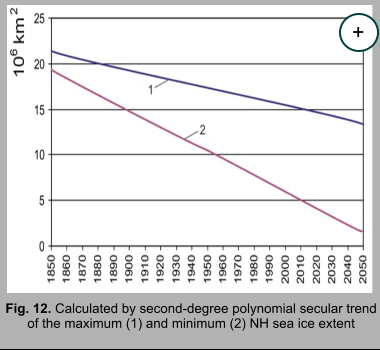 The maximum and minimum sea ice extent has been calculated on the basis
of the linear regression equations for the period from 1850 to 2050
(Fig. 12). The correlation between actual and calculated data is 0,835
for maximum sea ice extent. The average annual difference is – 0.229
mil. km2 in absolute value. It is 1.45% of the average annual
maximum of the sea ice extent from 1979 to 2013 or 79.1% of the average
module inter-annual variability for the observed data.
The maximum and minimum sea ice extent has been calculated on the basis
of the linear regression equations for the period from 1850 to 2050
(Fig. 12). The correlation between actual and calculated data is 0,835
for maximum sea ice extent. The average annual difference is – 0.229
mil. km2 in absolute value. It is 1.45% of the average annual
maximum of the sea ice extent from 1979 to 2013 or 79.1% of the average
module inter-annual variability for the observed data.
|
SOLAR RADIATION AND CLIMATE |
|
|||||
|
© www.solar-climate.com
|

|
|
||||||||||||||||||||||||||||||||||||||||||
|
|
|||
|
|||||||||||||


 |
 |