| |
SOLAR RADIATION AND CLIMATE
OF THE EARTH |
|
HISTORICAL STAGES IN THE RESEARCH OF LONG-TERM VARIATIONS OF SOLAR ACTIVITY V.M.
Fedorov Results of the research of long-term variations of solar activity for four hundred years have been summarized. The history of studies includes two major trends: the history of solar activity observations (since the beginning of the 17th century until present time) and the history of actual measurements (since the beginning of the 20th century until present time). The history of measurements of solar activity long-term variations (the solar constant) is divided into chronological periods reflecting various physical and technical measuring levels (from earth surface, from atmosphere, from space).
Solar radiation comes from the Sun, and it supplies heat and light to the Earth. Solar energy is relevant for the development of hydrometeorological and many other processes occurring in the atmosphere, hydrosphere, on Earth surface, and for life evolvement on the planet. So, the research of activity changes in the energy source occurring in the Earth geographical sphere and ensuring life existence on the planet, has a great importance in natural scientific research. The Sun continuously emits the energy into the surrounding space with flux power of around 3.94 • 1026 W. The Earth disc absorbs the energy equal to the product of solar constant and the Earth large circle. For average Earth radius of 6,371 km, the large circle area amounts to 1.275 • 1014 m2, and incoming radiant energy amounts to 1.743 • 1017 W. Yearly influx of solar radiation on the atmosphere upper border is 5.49 • 1024 J. (Drozdov et al., 1989; Hromov, Petrosyanz, 2006; Abdusamatov, 2009). This influx is not constant and is subject to long-term variations that occur against the background of century long trends. Long-term variations of solar activity coming to the Earth are basically defined by two reasons having different physical nature. One of the reasons is changes in the activity of Sun radiation. The other reason defining long-term variations of solar activity is celestial and mechanical processes causing changes of the Earth orbit elements (Fedorov. 2012). The article describes the history of the research of long-term variations related to the change in Sun’s radiating activity.
The History of Sunspot Research The history of the research of Sun’s radiating ability (solar activity) can be divided into two major stages. The first stage (since the beginning of the 17th century until present time) reflects scientific recording of solar activity. The second stage (since the beginning of the 20th century until present time) includes actual measurements of solar radiation as well. These major trends are divided into individual historical fragments marked in time by physical and technical benchmarks.
It is credibly known that the telescope was invented in Holland in 1608. The observation of celestial objects using the telescope was started almost simultaneously by the English mathematician Thomas Harriot, the German scientist Simon Marius and Galileo Galilei. His first telescopic observations Galilei published early in 1610 in the book entitled Sidereus Nuntius (Sidereal Messenger). These were the results of telescopic observations of the Moon, and the discovery of four Jupiter’s satellites. Also, Galilei observed Venus and Saturn using the telescope. A number of telescopic discoveries was crowned by the discovery of dark spots on the Sun. As Galilei claimed himself, he noticed them at the end of 1610 for the first time (Berry, 1904), but he seemed to have paid no particular attention (in the letter of May 4, 1612, he writes that he observed them 18 months earlier; in the conversation “of two systems,” he notes that had seen them while reading lectures in Padua, i.e., no later than September 1610). However, the official announcement of the discovery of sunspots was made by Galilei in May, of 1612, when they were discovered by Thomas Harriot in England, Johan Fabricius in Holland and the Jesuit Cristoforo Scheiner in Germany, and published by Fabricius in July of 1611 (Berry, 1904). It was Scheiner who discovered the faculae and made a number of observations over movements and emersion of spots (Berry, 1904). Sunspots had been previously observed with naked eye, but their origin was explained by Mercury passing along the Sun’s disc. Nothing was known about the periodicity of sunspots occurrence until 1843, when the German amateur astronomer, Heinrich Schwabe, pointed to an apparent 10-year periodicity revealed after 17 years of observations. Nevertheless, this discovery had remained unnoticed until the famous German geographer, Alexander Humboldt, published Schwabe’s conclusions (based on his 25 years of observations) in 1851 in his multi-volume treatise entitled The Space (Humboldt, 1866; Silkin, 1967; Maximov et al., 1970). With respect to Schwabe’s results (becoming known later), an international program for Sun observation was developed (and it’s still active). The basic goal of this program was the investigations and observations to determine whether the periodicity discovered by Schwabe is real and constant. Rudolph Wolf from the Zurich observatory was the one who organized and initiated these observations (his indicator for the number of sunspots—Wolf index or Wolf numbers—is used even now). Wolf conducted comprehensive investigations of historical data concerning the registration of sunspots to determine periodicity in the past. After long-term and results-oriented research, he collected historical proofs referring to the time period between the Schwabe’s observations and the discovery of spots using telescope (early in the 17th century). Wolf made a conclusion that the 11-year cycle really existed, starting with 1700, and perhaps even earlier. He restored the number of sunspots for this early period, and they were acclaimed to be true in all further works dedicated to the history of the Sun. More than half of the data given in Fig.1 is the result of Wolf’s research. The relative number of sunspots (Wolf index—W) is calculated as a sum of the number of spots (a) and a ten-fold number of all spot groups (b), i.e. W=a+10b (Eigenson et al., 1948; Vitinskiy, 1983). Or R = k (f + 10g), where f is the number of individual spots that combined in g of groups, k – empirical factor (Kondratyev, 1954, 1965; Bakulin et al., 1983; Abdusamatov, 2009). First of all, the importance of this index is defined by its simplicity. Second, it is important because its values (thanks to Wolf’s works) are known since 1700—yearly data, or since 1749—monthly data (Chernosky, Hagan, 1958; Eigenson, 1963; Kondratyev, 1965; Klimishin, 1976).
This distribution was studied by the English
Sun researcher Richard Carrington (results published in 1863 in the
monograph Observations of the Spots on the Sun) from the Royal
Greenwich Observatory. He found out that in the beginning of a 11-year
cycle, spots emerge in high latitudes (averagely, at In the late 20th century, Gustav Sporer and Edward Maunder studied archives of Sun observations and paid attention to a 70-year period (since the middle of the 17th century) with almost no sunspots reported (Eddy, 1976). In articles published later, Maunder concluded that during this time, from 1645 to 1715, a normal sunspot-forming cycle was completely or almost completely suppressed. He pointed that this phenomenon, if real, makes us doubt in the regular nature of the solar activity 11-year cycle. Later studies of this issue proved Maunder conclusions and revealed some additional facts that had been unknown in the time of Maunder (for example, for studying the frequency of aurora polaris described by high correlation relationship with the level of solar activity, isotopic ice, etc.). During this period (1645—1715), the solar activity showed lower levels than minimal modern cycles. As relative number spots values in this period change within 0-5, it was impossible to reveal their maximum, and the issue concerning the 11-year summer cycle for this period is still open. Regular observations of magnetic fields of sunspots discovered early in the previous century (1913) by the American astronomer G. Hale made everyone admit the existence of a 22-year cycle of solar activity. For a 14-year cycle (under Zurich numeration), Hale defined that the polarity of magnetic fields of leading spots (tail spots) of the northern (southern) hemisphere of the Sun changes oppositely when transiting from one 11-year cycle to the other (Struve, et al., 1967). Initial polarity is restored in 22 years. Further, such changes were observed during all following 11-year cycles. According to the Zurich numeration, in odd cycles, the magnetic field polarity of leading spots within groups of the northern hemisphere is positive, and in even cycles—it is negative (southern polarity). The southern hemisphere shows the opposite pattern (Anderson, 1939). Thus, 11-year and 22-year cycles of solar activity are deemed to be reliably determined (as for the present). Existence of longer cycles of solar activity is yet an assumption. For example, some researchers distinguish a secular (80—90-year) cycle of solar spots, i.e. Gleissberg cycle (Gleissberg, 1958; Eigenson, 1963; Abdusamatov, 2009). 80—90-year variation can be most clearly distinguished upon the sum of annual average Wolf numbers in a 11-year cycle, or upon their maximum values. Since 1749, two minimum values and three maximum values of secular cycles were distinguished for annual average relative numbers of spots. According to the Zurich numbering of 11-year cycles, minimum values occurred in 6th and 14th cycles, and maximum values—in the 3rd, 9th, and probably in 19th cycles. When decomposing Wolf numbers by main components number of spot groups and average duration of their existence, it appears that the first one basically shows changes with the average period of 11 years, and the second one—the average period of 80-90 years. It means that the 11-year cycle is typical for the frequency of solar activity phenomena, and the secular one—for their capacity (amplitude). But the problem of the secular variation of solar activity (and solar constant) is not yet settled. Some research note variations of solar activity with longer periods, for example, Zuss 200-year cycle (Schove, 1955; Abdusamatov, 2009). Currently, a number of companies has been collecting data and conducting regular observations of the Sun cycle and have counted the number of sunspots. For example, Solar Influences Data Analysis Center (SIDC) in Belgium (http://www.sidc.be). In this Department of Physics of the Royal Observatory the so called International Sunspot Number is determined. Besides, sunspots are counted in the National Oceanic and Atmospheric Administration (NOAA) in the U.S. (http://www.noaa.gov). The number of spots determined in the NOAA is called the NOAA sunspot number.
Solar Constant Measurements The history of measuring the solar constant includes measurements from the Earth surface, from the atmosphere (from aircrafts and air-balloons) and extra atmospheric measurements (from satellites and rockets) (Flux of Sun energy and its measurements, 1980). In meteorology, radiometric measurements have started in the late 19th century. To solve the problem of precision and to ensure the comparison of measurement results on various devices and stations, special radiometric scales were introduced. For many years, these standards and scales were subject to revision reflecting improvements in radiometry. Until the middle of the previous century, two scales were used: Angstrom’s (1905) and Smithsonian’s scale (1913). Just before the International Geophysical Year, the new International pyrheliometric scale was introduced (IPS, 1956), based on the abovementioned scales. Early in the previous century, the Smithsonian
astrophysical observatory started a series of high-mountain measurements
of the solar constant. According to the latest data (gathered throughout
half of the century), variations of the solar constant were 0.1 - 1%.
During measurements, long-term increase of the solar constant average
value was also found by 0.25% for 50 years (Abbot,
1957). Analysis of results obtained for four solar cycles (1908-1952)
showed that the limits of possible variations of the solar constant
are within Historically, first direct measurements
of the solar constant beyond the troposphere were made in the Leningrad
University in 1961 (by a group supervised by K.Y. Kondratyev). Measurement
devices were elevated at the altitude up to 32 km by an air-balloon.
Prior to 1967, the air-balloon was used 28 times. The observation methodology
and the results are in details described in a number of publications
(Kondratyev, 1965; Kondratyev et al., 1966; Kondratyev,
Nikolskiy, 1970,1982; Makarova, Kharitonov, 1972; Sun energy flux
and its changes, 1980). These measurements resulted in revealing
a noticeable variation of the solar constant (2.5%). Solar constant
value upon the results of all measurements was 1,356 In 1966, the Laboratory of reactive motion
(California Technological Institute) and the Eppley laboratory proposed
a program for measuring the solar constant, in which Drammond obtained
an average value of the solar constant upon the results of six trips
on the NASA reactive research aircraft, which equals to 1,359 In 1968–1969, R. Willson also made some
air-balloon measurements of the solar constant. The average value (upon
three air-balloon measurements) was 1,373 Changes in solar constant variations using
spaceships have high credibility since they are conducted beyond the
Earth atmosphere. These measurements do not include atmosphere extinction
(absorption and dissipation) and are made during many days. The first
long-term measurement of the solar constant beyond the Earth atmosphere
was made in the experiment conducted by the Laboratory of reactive motion
on Earth’s satellites Mariner-6 and Mariner-7 in 1969. Measurements
have shown that the solar constant value didn’t vary above the precision
limits (around In accordance with implementation of the
Earth Radiation Balance (ERB) program conducted onboard of Nimbus-6
launched in 1975, solar constant values were obtained within the range
of 1,388–1,392 W/m2. In 1976, simultaneous measurements of
the solar constant were made using a probe rocket (altitude around 100
km) and the space vehicle Nimbus-6. Average value for rocket data was
1,376 W/m2, upon the space vehicle data it was 1,376 As assessed by Frohlich, who reviewed
all measurements made using aircrafts, air-balloons and space vehicles,
the most probable value of the solar constant equals to 1,373
Table 1. Comparison of
measurement results for solar constant value
Numbers in parentheses correspond to standard deviations from weighted average values. Aircraft measurements are given for altitude 10—12 km, air balloon measurements for 20—36 km. Starting with the launch of American satellites Nimbus-7 (1978), and SMM (1980) equipped with cavity radiometers (H – F radiometer series ERB and active cavity radiometer AKRIM, respectively), a new stage in measuring the solar constant was commenced (Fig. 3)
With the internal precision achieved and compulsory application of sensitivity control, it became possible to define a precise value of the solar constant and observe its variations daily, weekly and more long-term ones (for example, satellite observations in experiments for measuring the solar constant within the NASA program intended to study the Sun activity and the Shuttle space program). The most informative materials were obtained from Nimbus-7 (launched in November, 1978) and SMM, Solar Maximum Mission (launched in February,1980). The solar constant value within the period under consideration was within 1,367–1,373 W/m2, and the average value was 1,370.59 W/m2 at the ERB scale in Nimbus-7 and 1,370.62 W/m2 in SMM. Decrease of the solar constant from the maximum value of the 21st cycle (1980) to the minimal value (1986) was determined to be 0.15%, or 2 W/m2. The yearly increment was averagely 0.02% (Willson, 1984 a, b; Makarova et al., 1991).
The amplitude of 11-year flattened cyclic
variations of the solar constant upon these measurements is about 1.0
W/m2 or around 0.07% of the average value of the solar constant.
Average minimal (21–23 cycles) values is 1,365.458
Thus, the history of the research of long-term
variations of solar activity amount to four hundred years. This history
includes two components in studying variations: observations (since
the 17th century to the present time) and measurements (since the 20th
century to the present time). The history of long-term solar activity
variations (solar constant) is divided into stages reflecting various
physical and technical levels of measurement (from the Earth surface,
from the atmosphere, from the space). In our studies, the data concerning Earth solar climate variations related to the Sun activity changes is not considered.
|
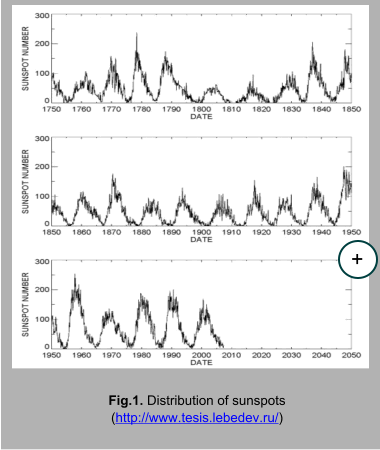 Relatively regular observations of the Sun have been conducted for almost
four hundred years. The result of these observations is a 11-year cycle
of solar activity expressed in quasi-periodical change of the number
of sunspots and being a basis for common ideas about the Sun and many
phenomena of the solar and terrestrial physics (Fig. 1). This periodicity
in spot formation is the most famous effect and it is quite well documented
and represents a widely observed phenomenon in astronomy. However, it
should be noted that continuous and rather precise measurements are
available for approximately one hundred years. Data for the time before
1850 is ambiguous for the most part. For more distant time, there are
few or no proofs that the modern 11-year cycle is a constant solar phenomenon.
(Eddy, 1980 a, b). Nevertheless, sunspots
are the most easily observed indicator of the solar activity level and
a source of the most continuously measured data in the history of the
Sun (Vitinskiy, 1983; Foukal, 2004).
Relatively regular observations of the Sun have been conducted for almost
four hundred years. The result of these observations is a 11-year cycle
of solar activity expressed in quasi-periodical change of the number
of sunspots and being a basis for common ideas about the Sun and many
phenomena of the solar and terrestrial physics (Fig. 1). This periodicity
in spot formation is the most famous effect and it is quite well documented
and represents a widely observed phenomenon in astronomy. However, it
should be noted that continuous and rather precise measurements are
available for approximately one hundred years. Data for the time before
1850 is ambiguous for the most part. For more distant time, there are
few or no proofs that the modern 11-year cycle is a constant solar phenomenon.
(Eddy, 1980 a, b). Nevertheless, sunspots
are the most easily observed indicator of the solar activity level and
a source of the most continuously measured data in the history of the
Sun (Vitinskiy, 1983; Foukal, 2004).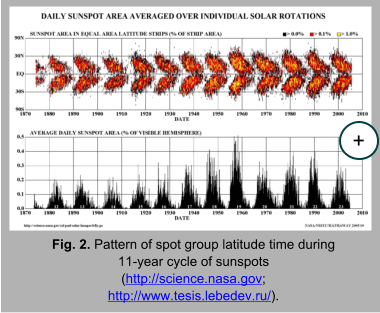 Around 160 years ago it was determined that the 11-year cycle of solar
activity is expressed not only in the change of the number of sunspots
(plages and solar flares), but also in the change of the spot group
latitude time (Fig.2). In 1852, three investigators, Eduard Sabin in
England, Rudolf Wolf and Alfred Gottier in Switzerland, independently
paid attention to specific correspondence between regular changes in
sunspots and Earth magnetic phenomena. Apart from the fact that their
periods are equal, it also occurs that during the ages with the highest
number of sunspots, a strongest magnetic storm takes place on the Earth.
Periods of attenuation for these phenomena also coincide (Berry,
1904).
Around 160 years ago it was determined that the 11-year cycle of solar
activity is expressed not only in the change of the number of sunspots
(plages and solar flares), but also in the change of the spot group
latitude time (Fig.2). In 1852, three investigators, Eduard Sabin in
England, Rudolf Wolf and Alfred Gottier in Switzerland, independently
paid attention to specific correspondence between regular changes in
sunspots and Earth magnetic phenomena. Apart from the fact that their
periods are equal, it also occurs that during the ages with the highest
number of sunspots, a strongest magnetic storm takes place on the Earth.
Periods of attenuation for these phenomena also coincide (Berry,
1904).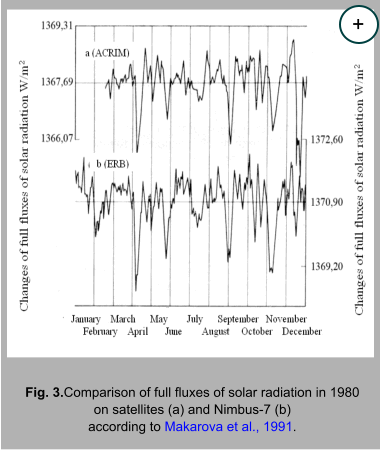 For the first time in the history of determining the solar constant,
its values reached the precision of two decimal places of a percent
(Willson, 1978, 1982, 1984 а, b; Willson, Hudson,
1988, 1991; Pap., Frohlich, 1999; Willson et al., 1981; Frohlich et
al., 1991; Livingston et al., 1991; Frohlich, 1988, 1989, 2000).
Improvement of measurements at that time was basically defined by three
factors: improvements of measurement devices (pyrheliometer) and increased
precision of each measurement; bringing devices beyond the Earth atmosphere
(fully eliminating errors of terrestrial observations, i.e. atmosphere
extinction); automation of observations and wide application of computer
equipment. As a result, high internal precision of observations was
achieved at the same satellite device
For the first time in the history of determining the solar constant,
its values reached the precision of two decimal places of a percent
(Willson, 1978, 1982, 1984 а, b; Willson, Hudson,
1988, 1991; Pap., Frohlich, 1999; Willson et al., 1981; Frohlich et
al., 1991; Livingston et al., 1991; Frohlich, 1988, 1989, 2000).
Improvement of measurements at that time was basically defined by three
factors: improvements of measurement devices (pyrheliometer) and increased
precision of each measurement; bringing devices beyond the Earth atmosphere
(fully eliminating errors of terrestrial observations, i.e. atmosphere
extinction); automation of observations and wide application of computer
equipment. As a result, high internal precision of observations was
achieved at the same satellite device 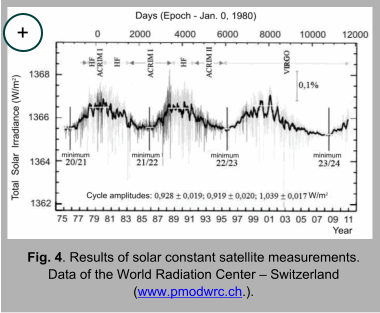 By now, a continuous number of direct measurements of the solar constant
has been provided by several special space vehicles since 1978 (Chapman
et al., 1996; Willson, 1997; Willson, Mordvinov, 2003). These
(technically complicated) measurements were made for three full cycles
of the solar activity (21-23) and are continued in the current 24th
cycle (Fig. 4).
By now, a continuous number of direct measurements of the solar constant
has been provided by several special space vehicles since 1978 (Chapman
et al., 1996; Willson, 1997; Willson, Mordvinov, 2003). These
(technically complicated) measurements were made for three full cycles
of the solar activity (21-23) and are continued in the current 24th
cycle (Fig. 4).
|
SOLAR RADIATION AND CLIMATE |
|
|||||
|
© www.solar-climate.com
|

|
|
||||||||||||||||||||||||||||||||||||||||||
|
|
|||
|
|||||||||||||


 |
 |